Laravel 9 Group Column Chart Using Highcharts
Websolutionstuff | Jan-02-2023 | Categories : Laravel PHP jQuery
In the world of web development, Laravel 9 is a user-friendly PHP framework. When combined with Highcharts, a top JavaScript charting library, they become a powerful team for creating engaging data visuals.
At the center of this partnership is the "Group Column Chart." This type of chart makes it easier to compare data by grouping points and using columns to show categories. It helps us understand complex data and find hidden patterns.
Laravel 9 manages data, and Highcharts turns it into attractive visuals. Together, they bring information to life, turning numbers into a compelling story that informs and enlightens.
Exploring Laravel 9 Group Column Charts using Highcharts will help us understand both the technical and artistic sides of making meaningful and impactful data visuals. So, let’s dive deeper:
Step 1: Install Laravel 9
Step 2: Create HighChartsController
Step 3: Add Route
Step 4: Create Blade File for Display Group Column Chart
Step 5: Add Script of Group Column Chart
In this step, we will install the laravel 9 application using the following command.
composer create-project laravel/laravel laravel-9-group-column-hightcharts
Now, we will create HighchartsController and add the highChart() function. So, add the below code to that file.
app/Http/Controllers/HighchartsController
<?php

namespace App\Http\Controllers;

use Illuminate\Http\Request;

class HighchartsController extends Controller
{
    public function groupHighChart()
    {

        return view('index', compact('group-column-chart'));

    }
}
In this step, we will add routes in the web.php file. So, add the following code to that file.
routes/web.php
use App\Http\Controllers\HighchartsController;

Route::get('highchart/group-column-chart', [HighchartsController::class, 'groupHighChart']);
In this step, we will create a group-column-chart.blade.php file. Also, we will add CSS and jQuery and add the following code to that file.
resources/views/group-column-chart.blade.php
<html>
    <head>
        <style>
            #container {
                height: 400px;
            }

            .highcharts-figure,
            .highcharts-data-table table {
                min-width: 310px;
                max-width: 800px;
                margin: 1em auto;
            }

            .highcharts-data-table table {
                font-family: Verdana, sans-serif;
                border-collapse: collapse;
                border: 1px solid #ebebeb;
                margin: 10px auto;
                text-align: center;
                width: 100%;
                max-width: 500px;
            }

            .highcharts-data-table caption {
                padding: 1em 0;
                font-size: 1.2em;
                color: #555;
            }

            .highcharts-data-table th {
                font-weight: 600;
                padding: 0.5em;
            }

            .highcharts-data-table td,
            .highcharts-data-table th,
            .highcharts-data-table caption {
                padding: 0.5em;
            }

            .highcharts-data-table thead tr,
            .highcharts-data-table tr:nth-child(even) {
                background: #f8f8f8;
            }

            .highcharts-data-table tr:hover {
                background: #f1f7ff;
            }
        </style>
    </head>
    <title>Laravel 9 Group Column Chart Using Highcharts - Websolutionstuff</title>
    <body>
        <div id="container"></div>
    </body>
</html>
Now, we will use the Highcharts() function to display group columns or group bar charts. So, add the script in the <head> tag or at the bottom of the HTML tag.
<script src="https://code.highcharts.com/highcharts.js"></script>
<script src="https://code.highcharts.com/modules/exporting.js"></script>
<script src="https://code.highcharts.com/modules/export-data.js"></script>
<script src="https://code.highcharts.com/modules/accessibility.js"></script>
<script>
    $(document).ready(function(){
        Highcharts.chart('container', {
            chart: {
                type: 'column'
            },

            title: {
                text: 'Laravel 9 Group Column Chart Using Highcharts - Websolutionstuff'
            },

            xAxis: {
                categories: ['Gold', 'Silver', 'Bronze']
            },

            yAxis: {
                allowDecimals: false,
                min: 0,
                title: {
                text: 'Count medals'
                }
            },

            tooltip: {
                formatter: function () {
                return '<b>' + this.x + '</b><br/>' +
                    this.series.name + ': ' + this.y;
                }
            },

            series: [{
                name: 'Norway',
                data: [148, 133, 124],
                stack: 'Europe'
            }, {
                name: 'Germany',
                data: [102, 98, 65],
                stack: 'Europe'
            }, {
                name: 'United States',
                data: [113, 122, 95],
                stack: 'North America'
            }, {
                name: 'Canada',
                data: [77, 72, 80],
                stack: 'North America'
            }]
        });
    });
</script>
Output:
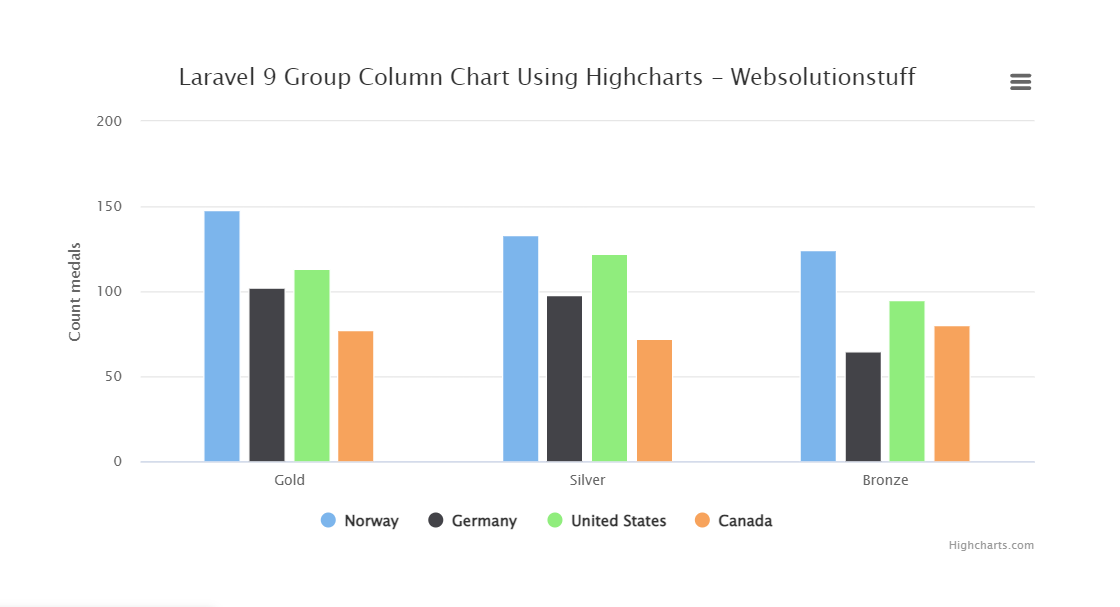
Creating Group Column Charts with Highcharts will not only make data engaging but also offer valuable insights at a glance.
You just need to follow the steps mentioned, and you will be on your way to transforming your data into stunning visualizations. So, take the first step today and make your information shine brightly in presentations and seminars!
You might also like:
- Read Also: Laravel 8 Google Bar Chart Example
- Read Also: How To Create Dynamic Bar Chart In Laravel
- Read Also: How To Create Dynamic Pie Chart In Laravel 9
- Read Also: How To Create Line Chart In Laravel 9 Using Highcharts
Recommended Post
Featured Post

How To Validate Password And C...
In this article, we will see how to validate password and confirm password in react js. Sometimes we need to add th...
Sep-14-2022

How To File Upload In Angular...
As an Angular 15 developer, I understand the significance of incorporating file upload functionality into web applicatio...
Jun-19-2023

Laravel 9 Inner Join Query Exa...
In this article, we will see laravel 9 inner join query example. Also, see how to join two tables in laravel 9. In larav...
Mar-30-2022

Import Export CSV/EXCEL File I...
Today I will show you how to implement/install the import/export package in laravel 6/7. We will simply create...
May-19-2020