How To Create Pie Chart In Laravel 9 Using Highcharts
Websolutionstuff | Oct-05-2022 | Categories : Laravel PHP jQuery
In this article, we will see how to create a pie chart in laravel 9 using highcharts. A pie chart is a circular statistical graphic, which is divided into slices to illustrate numerical proportion. In a pie chart, the arc length of each slice is proportional to the quantity it represents. You can learn laravel 9 highcharts pie charts example. Pie charts can be used to show percentages of a whole, and represents percentages at a set point in time.
Highcharts is a pure JavaScript based charting library meant to enhance web applications by adding interactive charting capability. Highcharts provides a wide variety of charts. Highcharts, the core library of our product suite, is a pure JavaScript charting library based on SVG that makes it easy for developers to create responsive, interactive, and accessible charts.
There are Highcharts wrappers available for frameworks such as React and Vue, as well as for native iOS and Android development. So, we will learn pie charts and highcharts examples in laravel 9.
So, let's see how to add a pie chart in laravel 9 using highcharts. Also, you can create a dynamic pie chart in laravel 9 using highcharts.
Step 1: Install Laravel 9 For Pie Chart Highcharts
Step 2: Add Route
Step 3: Create HighChartsController
Step 4: Create Blade File for Display Pie Chart
Step 5: Add Script For Pie Chart
In this step, we will install laravel 9 using the following command.
composer create-project laravel/laravel pie-chart-hightcharts-laravel-9
In this step, we will add routes in the web.php file
use App\Http\Controllers\HighchartsController;

Route::get('pie-chart/highchart', [HighchartsController::class, 'highChart']);
Now, we will create HighchartsController.
app/Http/Controllers/HighchartsController
<?php

namespace App\Http\Controllers;

use Illuminate\Http\Request;

class HighchartsController extends Controller
{
    public function highChart()
    {
        // For a dynamic pie chart you can pass "Data" from the controller.

        return view('index', compact('pie-chart'));
    }
}
In this step, we will create a pie-chart.blade.php file also we will add CSS and jQuery and add the following code to that file.
resources/views/pie-chart.blade.php
<html>
    <head>
        <style>
        .highcharts-figure,
        .highcharts-data-table table {
        min-width: 320px;
        max-width: 800px;
        margin: 50px auto;
        }

        .highcharts-data-table table {
        font-family: Verdana, sans-serif;
        border-collapse: collapse;
        border: 1px solid #ebebeb;
        margin: 10px auto;
        text-align: center;
        width: 100%;
        max-width: 500px;
        }

        .highcharts-data-table caption {
        padding: 1em 0;
        font-size: 1.2em;
        color: #555;
        }

        .highcharts-data-table th {
        font-weight: 600;
        padding: 0.5em;
        }

        .highcharts-data-table td,
        .highcharts-data-table th,
        .highcharts-data-table caption {
        padding: 0.5em;
        }

        .highcharts-data-table thead tr,
        .highcharts-data-table tr:nth-child(even) {
        background: #f8f8f8;
        }

        .highcharts-data-table tr:hover {
        background: #f1f7ff;
        }

        input[type="number"] {
        min-width: 50px;
        }
        </style>
    </head>
    <title>How To Add Pie Chart Highcharts In Laravel 9 - Websolutionstuff</title>
    <body>
        <figure class="highcharts-figure">
            <div id="container"></div>
        </figure>
    </body>
</html>
Now, we will add highcharts.js and its function to display pie charts. So, add the script in the <head> tag or at the bottom of the HTML tag.
<script src="https://code.highcharts.com/highcharts.js"></script>
<script src="https://code.highcharts.com/modules/exporting.js"></script>
<script src="https://code.highcharts.com/modules/export-data.js"></script>
<script src="https://code.highcharts.com/modules/accessibility.js"></script>
<script>
Highcharts.chart('container', {
    chart: {
        plotBackgroundColor: null,
        plotBorderWidth: null,
        plotShadow: false,
        type: 'pie'
    },
    title: {
        text: 'How To Create Pie Chart In Laravel 9 Using Highcharts - Websolutionstuff'
    },
        subtitle: {
            align: 'center',
            text: 'Browse market shares example'
        },
    tooltip: {
        pointFormat: '{series.name}: <b>{point.percentage:.1f}%</b>'
    },
    accessibility: {
        point: {
            valueSuffix: '%'
        }
    },
    plotOptions: {
        pie: {
        allowPointSelect: true,
        cursor: 'pointer',
            dataLabels: {
                enabled: true,
                format: '<b>{point.name}</b>: {point.percentage:.1f} %'
            }
        }
    },
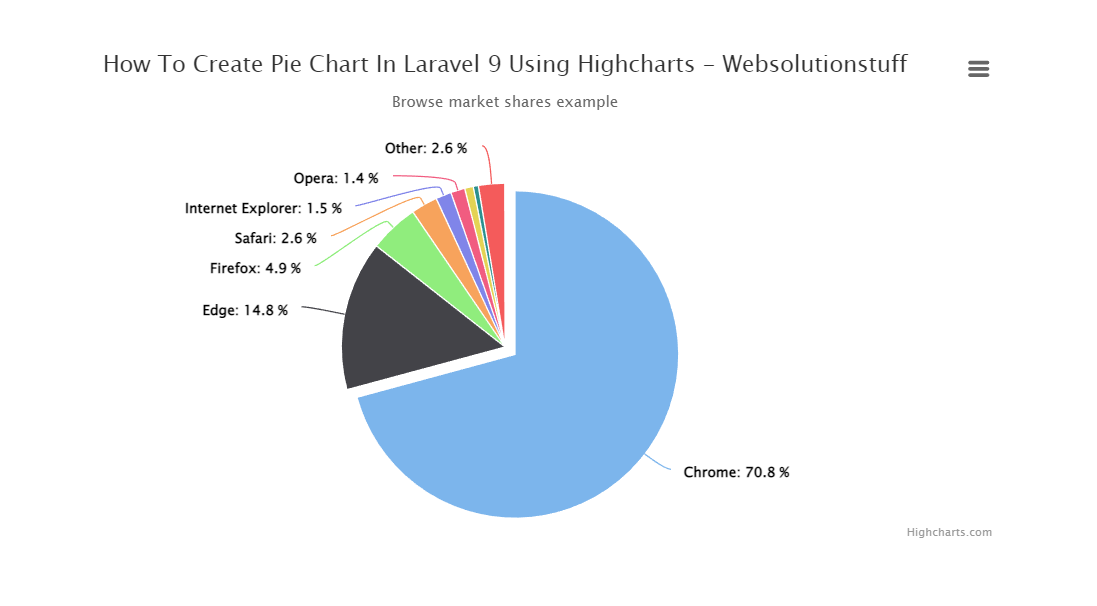
    series: [{
        name: 'Brands',
        colorByPoint: true,
        data: [{
            name: 'Chrome',
            y: 70.67,
            sliced: true,
            selected: true
        }, {
            name: 'Edge',
            y: 14.77
        },  {
            name: 'Firefox',
            y: 4.86
        }, {
            name: 'Safari',
            y: 2.63
        }, {
            name: 'Internet Explorer',
            y: 1.53
        },  {
            name: 'Opera',
            y: 1.40
        }, {
            name: 'Sogou Explorer',
            y: 0.84
        }, {
            name: 'QQ',
            y: 0.51
        }, {
            name: 'Other',
            y: 2.6
        }]
    }]
});
</script>
Output:

You might also like:
- Read Also: Laravel 9 CRUD Operation Example
- Read Also: Laravel 8 Google Pie Chart Example
- Read Also: Laravel 8 Yajra Datatable Example Tutorial
- Read Also: How To Store Multiple Checkbox Value In Database Using Laravel
Recommended Post
Featured Post

Node.js MySQL Create Database
In this tutorial we will see Node.js MySQL Create Database. For any kind data store or run query then we need database l...
Sep-22-2021

How to add Pagination in Larav...
Hello, laravel web developers! This article will show how to add pagination in laravel 11 Livewire. Here, we'll...
Jun-14-2024

Get User Location using IP Add...
Hello developers! In this article, we'll see how to get user location using an IP address in laravel 11. Here,...
May-01-2024

How To Integrate Swagger In la...
In the dynamic realm of modern web development, ensuring that APIs are well-documented, easy to comprehend, and seamless...
Aug-18-2023