How To Create Bar Chart In Laravel 9 Using Highcharts
Websolutionstuff | Oct-05-2022 | Categories : Laravel PHP jQuery
In this article, we will see how to create a bar chart in laravel 9 using highcharts. A bar chart or bar graph is a chart or graph that presents categorical data with rectangular bars with heights or lengths proportional to the values that they represent. The bars can be plotted vertically or horizontally. A vertical bar chart is sometimes called a column chart. You can learn laravel 9 highcharts bar chart example.
Highcharts is a standalone library, which means that it does not require any additional frameworks or plugins to work. It is solely based on native browser technologies, and all core functionality runs in the browser. It needs only the core highcharts.js script to run. So, we will learn bar charts and highcharts examples in laravel 9.
So, let's see how to add a bar chart in laravel 9 using highcharts. Also, you can create a dynamic bar chart in laravel 9 using highcharts
Step 1: Install Laravel 9 For Bar Chart
Step 2: Add Route
Step 3: Create HighChartsController
Step 4: Create Blade File for Display Bar Chart
Step 5: Add Script For Bar Chart
In this step, we will install laravel 9 using the following command.
composer create-project laravel/laravel bar-chart-hightcharts-laravel-9
In this step, we will add routes in the web.php file
use App\Http\Controllers\HighchartsController;

Route::get('bar-chart/highchart', [HighchartsController::class, 'highChart']);
Now, we will create HighchartsController.
app/Http/Controllers/HighchartsController
<?php

namespace App\Http\Controllers;

use Illuminate\Http\Request;

class HighchartsController extends Controller
{
    public function highChart()
    {
        // For a dynamic bar chart you can pass "Data" from the controller.

        return view('index', compact('bar-chart'));
    }
}
In this step, we will create a bar-chart.blade.php file also we will add CSS and jQuery and add the following code to that file.
resources/views/bar-chart.blade.php
<html>
    <head>
        <style>
            .highcharts-figure,
            .highcharts-data-table table {
            min-width: 310px;
            max-width: 800px;
            margin: 50px auto;
            {"}"}

            #container {
            height: 400px;
            }

            .highcharts-data-table table {
            font-family: Verdana, sans-serif;
            border-collapse: collapse;
            border: 1px solid #ebebeb;
            margin: 10px auto;
            text-align: center;
            width: 100%;
            max-width: 500px;
            }

            .highcharts-data-table caption {
            padding: 1em 0;
            font-size: 1.2em;
            color: #555;
            }

            .highcharts-data-table th {
            font-weight: 600;
            padding: 0.5em;
            }

            .highcharts-data-table td,
            .highcharts-data-table th,
            .highcharts-data-table caption {
            padding: 0.5em;
            }

            .highcharts-data-table thead tr,
            .highcharts-data-table tr:nth-child(even) {
            background: #f8f8f8;
            }

            .highcharts-data-table tr:hover {
            background: #f1f7ff;
            }
        </style>
    </head>
    <title>How To Add Bar Chart Highcharts In Laravel 9 - Websolutionstuff</title>
    <body>
        <figure class="highcharts-figure">
            <div id="container"></div>
        </figure>
    </body>
</html>
Now, we will add highcharts.js and its function to display bar charts. So, add the script in the <head> tag or at the bottom of the HTML tag.
<script src="https://code.highcharts.com/highcharts.js"></script>
<script src="https://code.highcharts.com/modules/data.js"></script>
<script src="https://code.highcharts.com/modules/drilldown.js"></script>
<script src="https://code.highcharts.com/modules/exporting.js"></script>
<script src="https://code.highcharts.com/modules/export-data.js"></script>
<script src="https://code.highcharts.com/modules/accessibility.js"></script>
<script>
Highcharts.chart('container', {
chart: {
type: 'column'
},
title: {
align: 'center',
text: 'How To Create Bar Chart In Laravel 9 Using Highcharts - Websolutionstuff'
},
subtitle: {
align: 'center',
text: 'Click the columns to view versions.'
},
accessibility: {
announceNewData: {
enabled: true
}
},
xAxis: {
type: 'category'
},
yAxis: {
title: {
text: 'Total percent market share'
}
},
legend: {
enabled: false
},
plotOptions: {
series: {
borderWidth: 0,
dataLabels: {
enabled: true,
format: '{point.y:.1f}%'
}
}
},
tooltip: {
headerFormat: '<span style="font-size:11px">{series.name}</span><br>',
pointFormat: '<span style="color:{point.color}">{point.name}</span>: <b>{point.y:.2f}%</b> of total<br/>'
},
series: [
{
name: "Browsers",
colorByPoint: true,
data: [
{
name: "Chrome",
y: 63.06,
drilldown: "Chrome"
},
{
name: "Safari",
y: 19.84,
drilldown: "Safari"
},
{
name: "Firefox",
y: 4.18,
drilldown: "Firefox"
},
{
name: "Edge",
y: 4.12,
drilldown: "Edge"
},
{
name: "Opera",
y: 2.33,
drilldown: "Opera"
},
{
name: "Internet Explorer",
y: 0.45,
drilldown: "Internet Explorer"
},
{
name: "Other",
y: 1.582,
drilldown: null
}
]
}
],
drilldown: {
breadcrumbs: {
position: {
align: 'right'
}
},
series: [
{
name: "Chrome",
id: "Chrome",
data: [
[
"v65.0",
0.1
],
[
"v64.0",
1.3
],
[
"v63.0",
53.02
],
[
"v62.0",
1.4
],
[
"v61.0",
0.88
],
[
"v60.0",
0.56
],
[
"v59.0",
0.45
],
[
"v58.0",
0.49
],
[
"v57.0",
0.32
],
[
"v56.0",
0.29
],
[
"v55.0",
0.79
],
[
"v54.0",
0.18
],
[
"v51.0",
0.13
],
[
"v49.0",
2.16
],
[
"v48.0",
0.13
],
[
"v47.0",
0.11
],
[
"v43.0",
0.17
],
[
"v29.0",
0.26
]
]
},
{
name: "Firefox",
id: "Firefox",
data: [
[
"v58.0",
1.02
],
[
"v57.0",
7.36
],
[
"v56.0",
0.35
],
[
"v55.0",
0.11
],
[
"v54.0",
0.1
],
[
"v52.0",
0.95
],
[
"v51.0",
0.15
],
[
"v50.0",
0.1
],
[
"v48.0",
0.31
],
[
"v47.0",
0.12
]
]
},
{
name: "Internet Explorer",
id: "Internet Explorer",
data: [
[
"v11.0",
6.2
],
[
"v10.0",
0.29
],
[
"v9.0",
0.27
],
[
"v8.0",
0.47
]
]
},
{
name: "Safari",
id: "Safari",
data: [
[
"v11.0",
3.39
],
[
"v10.1",
0.96
],
[
"v10.0",
0.36
],
[
"v9.1",
0.54
],
[
"v9.0",
0.13
],
[
"v5.1",
0.2
]
]
},
{
name: "Edge",
id: "Edge",
data: [
[
"v16",
2.6
],
[
"v15",
0.92
],
[
"v14",
0.4
],
[
"v13",
0.1
]
]
},
{
name: "Opera",
id: "Opera",
data: [
[
"v50.0",
0.96
],
[
"v49.0",
0.82
],
[
"v12.1",
0.14
]
]
}
]
}
});
</script>
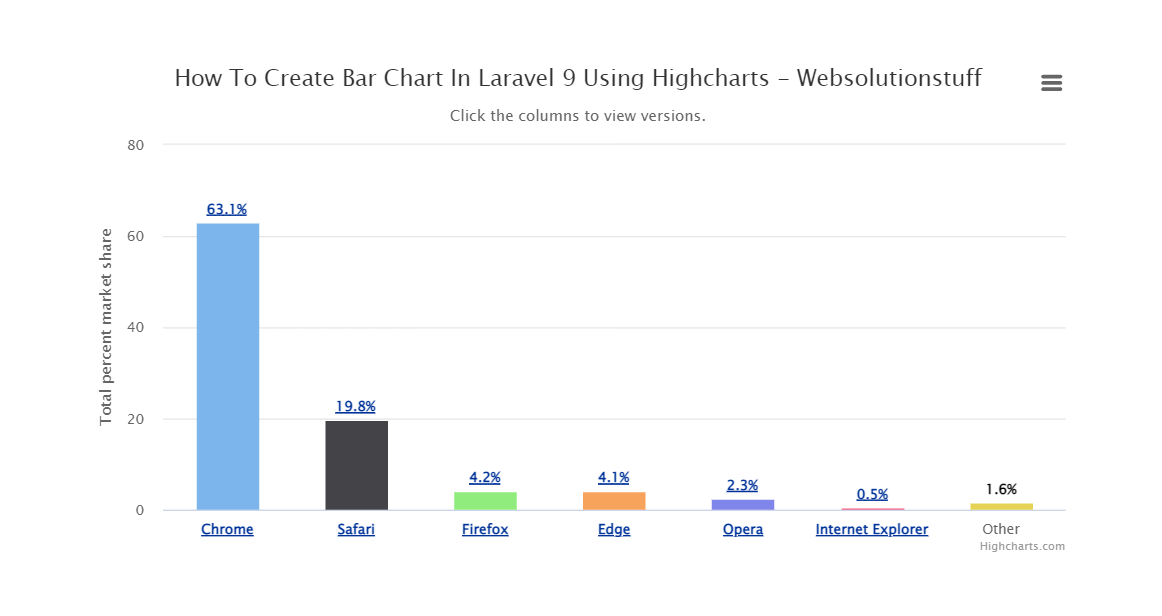
Output:
You might also like:
- Read Also: Laravel 8 Google Bar Chart Example
- Read Also: How To Generate Barcode In Laravel
- Read Also: Laravel 8 Socialite Login with Google Account
- Read Also: Laravel 9 REST API With Passport Authentication
Recommended Post
Featured Post

How to Send Bulk Mail Using Qu...
In this article, we will see how to send bulk mail using queue in laravel 9. Laravel queue is used for sending bulk...
Mar-15-2022

How To Send Email With Attachm...
In this tutorial i will show you how to send email with attachment in laravel 8. As we all know mail functionalities are...
May-05-2021

How to Convert Word Docx to PD...
Hello, laravel web developers! In this article, we'll see how to convert Word doc to PDF in laravel 11. In laravel 1...
Jul-01-2024

How to Upgrade PHP 7.4 to 8.0...
Hey there! I recently faced the need to upgrade my PHP version from 7.4 to the latest 8.0 on my Ubuntu server. It might...
Nov-06-2023