How to Create Apexcharts Line Chart in Laravel 11
Websolutionstuff | Apr-22-2024 | Categories : Laravel PHP jQuery
Hello developers! In this article, we'll see how to create apexcharts line chart in laravel 11. ApexCharts is a modern charting library that helps developers to create beautiful and interactive visualizations for web pages.
It is an open-source project and is free to use in commercial applications. In this guide, we'll learn to create a simple dynamic line chart example in laravel 11.
Additionally, you can create dynamic pie charts, and bar charts, with the help of ApexCharts and also you can customize them as per requirements.
In this step, we will install the laravel 11 application using the following command.
composer create-project laravel/laravel laravel_11_line_chart
Then, we will define the route to the web.php file. So, add the below code to that file.
routes/web.php
<?php

use Illuminate\Support\Facades\Route;

use App\Http\Controllers\UsersController;

/*
|--------------------------------------------------------------------------
| Web Routes
|--------------------------------------------------------------------------
|
| Here is where you can register web routes for your application. These
| routes are loaded by the RouteServiceProvider within a group which
| contains the "web" middleware group. Now create something great!
|
*/

Route::get('index', [UsersController::class, 'create']);
Route::post('store', [UsersController::class, 'store'])->name('store');
Next, we'll create a UsersController.php file using the following code.
php artisan make:controller UsersController
app/Http/Controllers/UsersController.php
<?php

namespace App\Http\Controllers;

use Illuminate\Http\Request;
use Illuminate\View\View;
use Illuminate\Http\RedirectResponse;
use App\Rules\Uppercase;

class UsersController extends Controller
{
    /**
     * Show the application dashboard.
     *
     * @return \Illuminate\Http\Response
     */
    public function create(): View
    {
        return view('index');
    }
}
Then, we will create an index.blade.php file for the display of Apexchart line char in laravel 11.
<!DOCTYPE html>
<html>
<head>
<title>How to Create Apexcharts Line Chart in Laravel 11 - Websolutionstuff</title>
<meta charset="utf-8">
<meta http-equiv="X-UA-Compatible" content="IE=edge">
<meta name="viewport" content="width=device-width, initial-scale=1">
<link href="https://cdn.jsdelivr.net/npm/[email protected]/dist/css/bootstrap.min.css" rel="stylesheet">
<style>
@import url(https://fonts.googleapis.com/css?family=Roboto);
body {
font-family: Roboto, sans-serif;
}
#chart {
max-width: 650px;
margin: 35px auto;
}
</style>
</head>
<body>
<div class="container">
<h1>How to Create Apexcharts Line Chart in Laravel 11 - Websolutionstuff</h1>
<div id="chart"></div>
</div>
<script src="https://cdn.jsdelivr.net/npm/apexcharts"></script>
<script>
var options = {
series: [{
name: "Desktops",
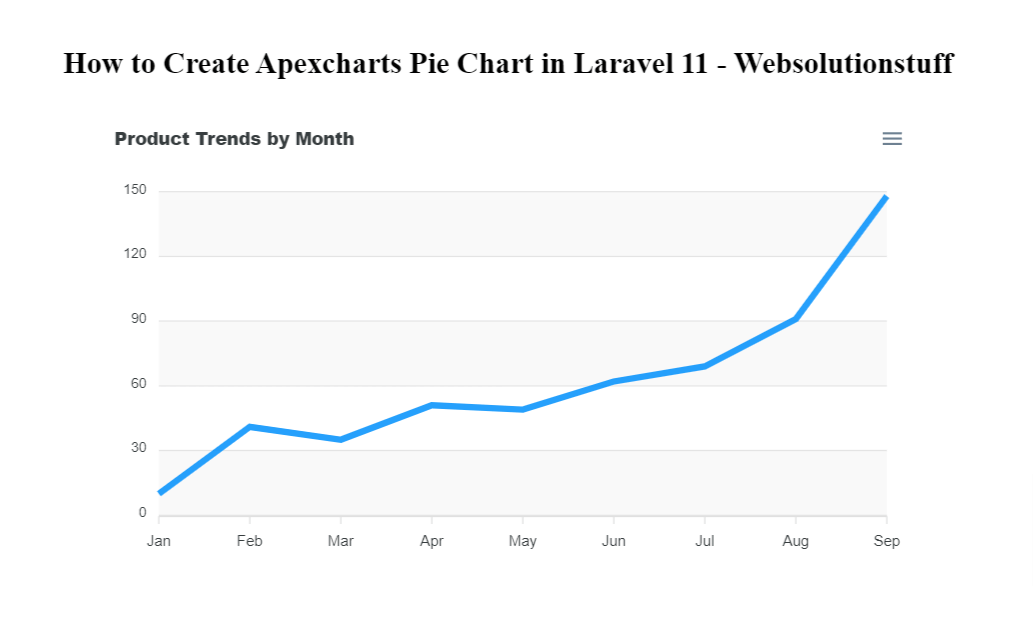
data: [10, 41, 35, 51, 49, 62, 69, 91, 148]
}],
chart: {
height: 350,
type: 'line',
zoom: {
enabled: false
}
},
dataLabels: {
enabled: false
},
stroke: {
curve: 'straight'
},
title: {
text: 'Product Trends by Month',
align: 'left'
},
grid: {
row: {
colors: ['#f3f3f3', 'transparent'], // takes an array which will be repeated on columns
opacity: 0.5
},
},
xaxis: {
categories: ['Jan', 'Feb', 'Mar', 'Apr', 'May', 'Jun', 'Jul', 'Aug', 'Sep'],
}
};
var chart = new ApexCharts(document.querySelector("#chart"), options);
chart.render();
</script>
</body>
</html>
Output:
You might also like:
- Read Also: Laravel 9 Paypal Payment Gateway Integration
- Read Also: How To Create Dynamic Line Chart In Laravel 9
- Read Also: Google Line Chart Example in Laravel 8
- Read Also: How To Create Line Chart In Laravel 9 Using Highcharts
Recommended Post
Featured Post

Login with Mobile Number using...
In this tutorial i will show you how to login with mobile number in laravel using Laravel Custom Auth , laravel pro...
Jun-18-2021

Laravel 11 CRUD with Image Upl...
In this article, we'll see laravel 11 crud with an image upload example. Here, we'll perform a crud operation on...
Apr-26-2024

How To Get Multiple Checkbox V...
Checkboxes let us make multiple choices. But how do you actually use them in JavaScript? It might seem tricky, especiall...
Jan-10-2023

Laravel whereHas and orWhereHa...
In this article, we will see the laravel whereHas and orWhereHas query example. whereHas and orWhereHas query is us...
Jan-19-2021