Google Line Chart Example in Laravel 8
Websolutionstuff | Feb-24-2021 | Categories : Laravel PHP jQuery
In this article, we will see the google line chart example in laravel 8. Google charts use to visualize data on your website. here we will see a line chart example or google chart in laravel 7/8. A line chart can also be used to compare changes over the same period of time for more than one group. So, here we will learn how to use google charts in laravel 7 and laravel 8.
So, let's see laravel 7/8 google line chart example and dynamic google line charts in laravel 8.
Here, I have added a few steps of the google line chart example in laravel 8.
Step 1: Install Laravel 8
Step 2: Create Migration
Step 3: Add Route
Step 4: Create Controller and Model
Step 5: Create Blade File
Install a new project in your laravel application for google line chart tutorial.
composer create-project --prefer-dist laravel/laravel google_linechart
We are getting dynamic data for the line chart example. So first, we need to create migration for the "product" table using the laravel php artisan command. So, first type the below command:
php artisan make:migration create_products_table --create=products
After running this command you will find php file in this location "database/migrations/" in this file you need to add the below code.
<?php

use Illuminate\Database\Migrations\Migration;
use Illuminate\Database\Schema\Blueprint;
use Illuminate\Support\Facades\Schema;

class CreateProductsTable extends Migration
{
    public function up()
    {
        Schema::create('products', function (Blueprint $table) {
            $table->id();
            $table->string('name')->nullable();
            $table->integer('price')->nullable();
            $table->integer('year')->nullable();
            $table->string('product_type')->nullable();
            $table->timestamps();
        });
    }
    public function down()
    {
        Schema::dropIfExists('products');
    }
}
after this we need to run this migration by following the command in our terminal:
php artisan migrate
And after migration, you need to add some records as per the below screen print.
Now add a route in Routes/web.php
Route::get('linechart', 'LinechartController@linechart');
After adding the route we need to create a new controller and model for the google line chart example. So, type the below command in your terminal to create a controller.
php artisan make:controller LinechartController
php artisan make:model Product
Now add the below code in your linechartcontroller.
<?php

namespace App\Http\Controllers;

use Illuminate\Http\Request;
use App\Product;

class LinechartController extends Controller
{
    public function linechart(Request $request)
    {
    	$phone_count_18 = Product::where('product_type','phone')->where('year','2018')->get()->count();
    	$phone_count_19 = Product::where('product_type','phone')->where('year','2019')->get()->count();
    	$phone_count_20 = Product::where('product_type','phone')->where('year','2020')->get()->count();

    	$laptop_count_18 = Product::where('product_type','laptop')->where('year','2018')->get()->count();
    	$laptop_count_19 = Product::where('product_type','laptop')->where('year','2019')->get()->count();
    	$laptop_count_20 = Product::where('product_type','laptop')->where('year','2020')->get()->count();

    	$tablet_count_18 = Product::where('product_type','tablet')->where('year','2018')->get()->count();
    	$tablet_count_19 = Product::where('product_type','tablet')->where('year','2019')->get()->count();
    	$tablet_count_20 = Product::where('product_type','tablet')->where('year','2020')->get()->count();

    	return view('linechart',compact('phone_count_18','phone_count_19','phone_count_20','laptop_count_18','laptop_count_19','laptop_count_20','tablet_count_18','tablet_count_19','tablet_count_20'));
    }
}
In this step, we are creating a blade file to view the output of the line chart. So, copy the below code in your linechart.blade.php file.
<html>
<head>
    <title>Laravel 8 Google Line Chart Tutorial - websolutionstuff.com</title>
    <script type="text/javascript" src="https://www.gstatic.com/charts/loader.js"></script>
</head>
<body>
    <h2 style="margin:50px 0px 0px 0px;text-align: center;">Laravel 8 Google Line Chart Tutorial - websolutionstuff.com</h2>
    <div id="linechart" style="width: 900px; height: 500px; margin-left: 235px"></div>
    <script type="text/javascript">
        var phone_count_18 = <?php echo $phone_count_18; ?>;
        var phone_count_19 = <?php echo $phone_count_19; ?>;
        var phone_count_20 = <?php echo $phone_count_20; ?>;

        var laptop_count_18 = <?php echo $laptop_count_18; ?>;
        var laptop_count_19 = <?php echo $laptop_count_19; ?>;
        var laptop_count_20 = <?php echo $laptop_count_20; ?>;

        var tablet_count_18 = <?php echo $tablet_count_18; ?>;
        var tablet_count_19 = <?php echo $tablet_count_19; ?>;
        var tablet_count_20 = <?php echo $tablet_count_20; ?>;

        google.charts.load('current', {'packages':['corechart']});
        google.charts.setOnLoadCallback(drawChart);
        function drawChart() {
             var data = google.visualization.arrayToDataTable([
          ['Year', 'Phone', 'Laptop', 'Tablet'],
          ['2018',  phone_count_18, laptop_count_18, tablet_count_18],
          ['2019',  phone_count_19, laptop_count_19, tablet_count_19],
          ['2020',  phone_count_20, laptop_count_20, tablet_count_20]
        ]);
            var options = {
                curveType: 'function',
                legend: { position: 'bottom' }
            };
            var chart = new google.visualization.LineChart(document.getElementById('linechart'));
            chart.draw(data, options);
        }
    </script>
</body>
</html>
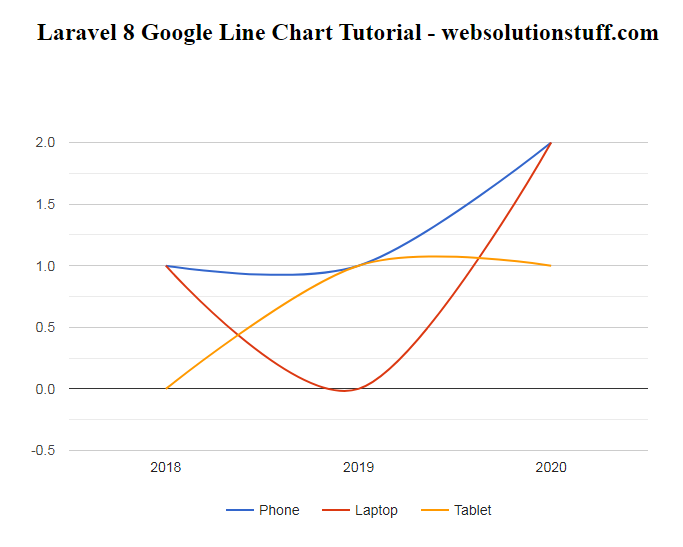
After all implement of these steps, you will get the output of a laravel 8 google line chart tutorial like the below image.
You might also like:
- Read Also: Laravel 8 Google Pie Chart Example
- Read Also: Laravel 8 Socialite Login with Google Account
- Read Also: Google Map With Draggable Marker Example
- Read Also: How To Use Google Recaptcha V2 In Laravel 9
Recommended Post
Featured Post

How To Generate PDF and Send E...
In this tutorial we will see how to generate pdf and send email in laravel 8. For generating PDF file we will use l...
Dec-20-2021

How to Create Auto Generate Sl...
Creating an auto-generating slug using Laravel Livewire is a practical and efficient way to handle slugs for your applic...
Oct-27-2023

How To Create Validation Rule...
In this article, we will see how to create a validation rule in laravel 10. Here, we will learn about the laravel 1...
May-22-2023

How To Get Children Element In...
In this article, we will see how to get the children of this selector in jquery. You can use the find() method...
Jul-13-2022