Laravel 10 Apexcharts Bar Chart Example
Websolutionstuff | May-24-2023 | Categories : Laravel jQuery
In this article, we will see the laravel 10 apexcharts bar chart example. Here, we will learn about how to create a bar chart in laravel 10 using apexcharts. ApexCharts is a modern charting library that helps developers to create beautiful and interactive visualizations for web pages.
ApexCharts are flexible and responsive - making your charts work on desktops, tablets as well as mobiles. ApexCharts.js is an open-source project licensed under MIT and is free to use in commercial applications. Also, you can customize the configuration as per your requirements.
So, let's see how to implement a bar chart in laravel 10, how to create apexcharts bar chart in laravel 10, apexcharts in laravel, and apexcharts bar chart example.
In this step, we will install laravel 10 application using the following command.
composer create-project laravel/laravel laravel_10_barchart_example
Then, we will create a route to the web.php file. So, add the below code to that file.
routes/web.php
<?php

use Illuminate\Support\Facades\Route;

use App\Http\Controllers\UsersController;

/*
|--------------------------------------------------------------------------
| Web Routes
|--------------------------------------------------------------------------
|
| Here is where you can register web routes for your application. These
| routes are loaded by the RouteServiceProvider within a group which
| contains the "web" middleware group. Now create something great!
|
*/

Route::get('index', [UsersController::class, 'create']);
Route::post('store', [UsersController::class, 'store'])->name('store');
Now, we will create UsersController using the following code. And add the following code to that file.
php artisan make:controller UsersController
app/Http/Controllers/UsersController.php
<?php

namespace App\Http\Controllers;

use Illuminate\Http\Request;
use Illuminate\View\View;
use Illuminate\Http\RedirectResponse;
use App\Rules\Uppercase;

class UsersController extends Controller
{
    /**
     * Show the application dashboard.
     *
     * @return \Illuminate\Http\Response
     */
    public function create(): View
    {
        return view('index');
    }
}
Then, we will create an index.blade.php file. So, add the following HTML code to that file.
<!DOCTYPE html>
<html>
<head>
<title>Laravel 10 Apexcharts Bar Chart Example - Websolutionstuff</title>
<meta charset="utf-8">
<meta http-equiv="X-UA-Compatible" content="IE=edge">
<meta name="viewport" content="width=device-width, initial-scale=1">
<link href="https://cdn.jsdelivr.net/npm/[email protected]/dist/css/bootstrap.min.css" rel="stylesheet">
<style>
@import url(https://fonts.googleapis.com/css?family=Roboto);
body {
font-family: Roboto, sans-serif;
}
#chart {
max-width: 650px;
margin: 35px auto;
}
</style>
</head>
<body>
<div class="container">
<h1>Laravel 10 Apexcharts Bar Chart Example - Websolutionstuff</h1>
<div id="chart"></div>
</div>
<script>
var options = {
chart: {
type: 'bar'
},
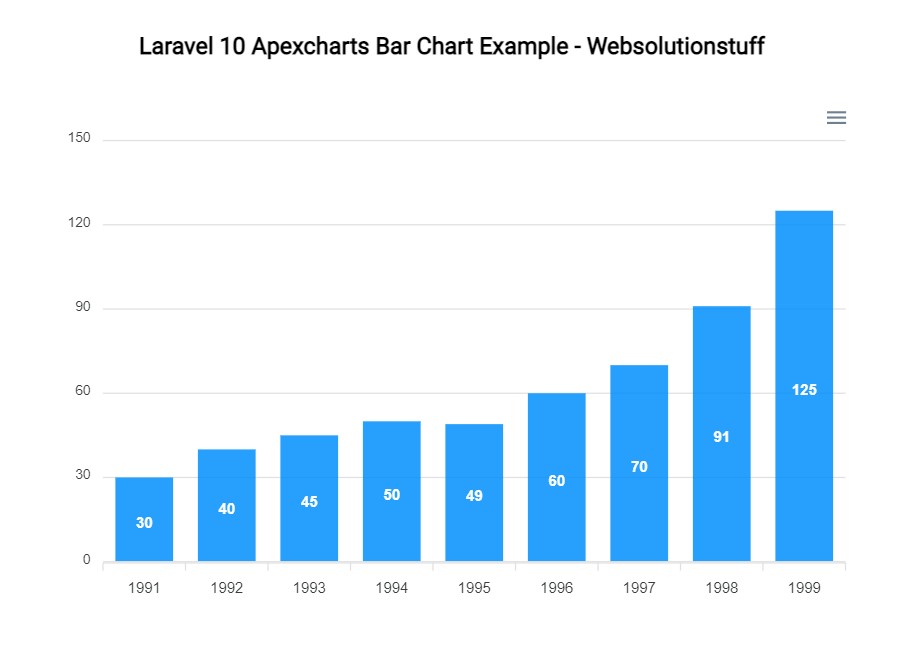
series: [{
name: 'sales',
data: [30,40,45,50,49,60,70,91,125]
}],
xaxis: {
categories: [1991,1992,1993,1994,1995,1996,1997, 1998,1999]
}
}
var chart = new ApexCharts(document.querySelector("#chart"), options);
chart.render();
</script>
</body>
</html>
Output:
You might also like:
- Read Also: How To Create Validation Rule In Laravel 10
- Read Also: How To Implement Google Bar Chart In Vue Js
- Read Also: Laravel 9 Group Column Chart Using Highcharts
- Read Also: How To Create Bar Chart In Laravel 9 Using Highcharts
Recommended Post
Featured Post

Laravel Rollback Targeted Migr...
As a Laravel developer, I understand the significance of migrations in managing database changes and maintaining a consi...
May-29-2023

How To Get Current User Locati...
In this example, I will show you how to get the current user location in laravel, Many times we are required to find the...
Jun-10-2020

Adding Bootstrap 5 To Angular...
Welcome to my comprehensive step-by-step guide on integrating Bootstrap 5 into Angular 15. As a developer, I understand...
Jun-12-2023

Laravel 8 Form Class Not Found
In this small post, we will solve the laravel 8 form class not found error, many time we have received errors like the l...
Mar-12-2021