Laravel 11 ChartJS Line Chart Example
Websolutionstuff | May-10-2024 | Categories : Laravel jQuery
Hello developer! In this article, we'll see how to create a dynamic line chart in laravel 11 using chart js. You can easily create a line chart using ChartJS jQuery. Chart.js is a free, open-source JavaScript library for data visualization, which supports eight chart types: bar, line, area, pie, bubble, radar, polar, and scatter.
ChartJS is a Simple yet flexible JavaScript charting library for the modern web. Also, you can use with npm and CDN.
Laravel 11 ChartJS Line Chart

In this step, we'll install the laravel 11 application using the following command.
composer create-project laravel/laravel laravel-11-chart-example
Now, we'll define routes into the web.php file
routes/web.php
<?php

use Illuminate\Support\Facades\Route;

use App\Http\Controllers\ChartJSController;

Route::get('chart', [ChartJSController::class, 'index']);
Next, we'll create a ChartJSController.php using the following command and define the function.
app/Http/Controllers/ChartJSController.php
<?php

namespace App\Http\Controllers;

use Illuminate\Http\Request;
use Illuminate\View\View;
use App\Models\User;
use DB;

class ChartJSController extends Controller
{
    /**
     * Write code on Method
     *
     * @return View
     */
    public function index(): View
    {
        $users = User::select(DB::raw("COUNT(*) as count"), DB::raw("MONTHNAME(created_at) as month_name"))
                    ->whereYear('created_at', date('Y'))
                    ->groupBy(DB::raw("Month(created_at)"))
                    ->pluck('count', 'month_name');

        $labels = $users->keys();
        $data = $users->values();

        return view('chart', compact('labels', 'data'));
    }
}
Then, we'll create a blade file and also use chartjs line chart.
resources/views/chart.blade.php
<!DOCTYPE html>
<html>
<head>
    <title>Laravel 11 ChartJS Line Chart Example - Techsolutionstuff</title>
    <link href="https://cdn.jsdelivr.net/npm/[email protected]/dist/css/bootstrap.min.css" rel="stylesheet" crossorigin="anonymous">
</head>

<body>
    <div class="container">
        <div class="card mt-5">
            <h3 class="card-header p-3">Laravel 11 ChartJS Chart Example - ItSolutionStuff.com</h3>
            <div class="card-body">
                <canvas id="myChart" height="120px"></canvas>
            </div>
        </div>
    </div>
</body>

<script src="https://cdnjs.cloudflare.com/ajax/libs/jquery/3.6.0/jquery.min.js" ></script>
<script src="https://cdn.jsdelivr.net/npm/chart.js"></script>

<script type="text/javascript">

      var labels =  {{ Js::from($labels) }};
      var users =  {{ Js::from($data) }};

      const data = {
        labels: labels,
        datasets: [{
          label: 'My First dataset',
          backgroundColor: 'rgb(255, 99, 132)',
          borderColor: 'rgb(255, 99, 132)',
          data: users,
        }]
      };

      const config = {
        type: 'line',
        data: data,
        options: {}
      };

      const myChart = new Chart(
        document.getElementById('myChart'),
        config
      );

</script>
</html>
Next, we'll create dummy records for testing purposes using the tinker.
php artisan tinker

User::factory()->count(50)->create()
Now, run the laravel 11 application using the following command.
php artisan serve
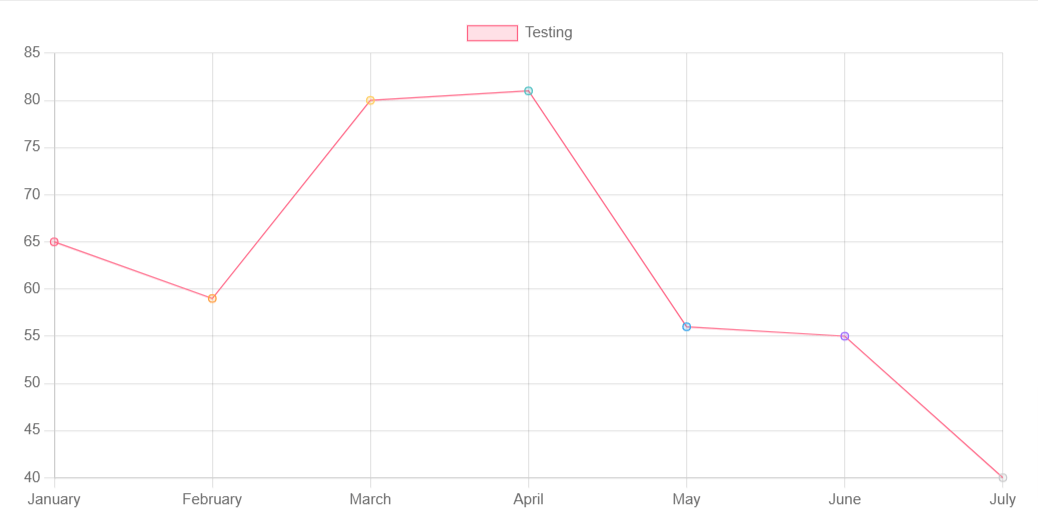
Output:
You might also like:
Recommended Post
Featured Post

How To File Upload In Laravel...
In this article, we will see how to file upload in laravel 10 examples. Here, we will learn about the laravel...
Mar-15-2023

How To Send Email With Attachm...
In this article, we will see how to send email with attachments in laravel 9. As we all know mail functionalities are co...
Mar-16-2022

How To Upload Large CSV File U...
In this article, we will see how to upload a large CSV file using queue in laravel 9. Here we will learn large numb...
Sep-16-2022

How to Force Redirect Http to...
In this small artical we will see how to force redirect http to https in laravel, Here i will show you two method in&nbs...
Aug-11-2021