Laravel 8 Highcharts Example Tutorial
Websolutionstuff | Jul-02-2021 | Categories : Laravel PHP
Hello guys,
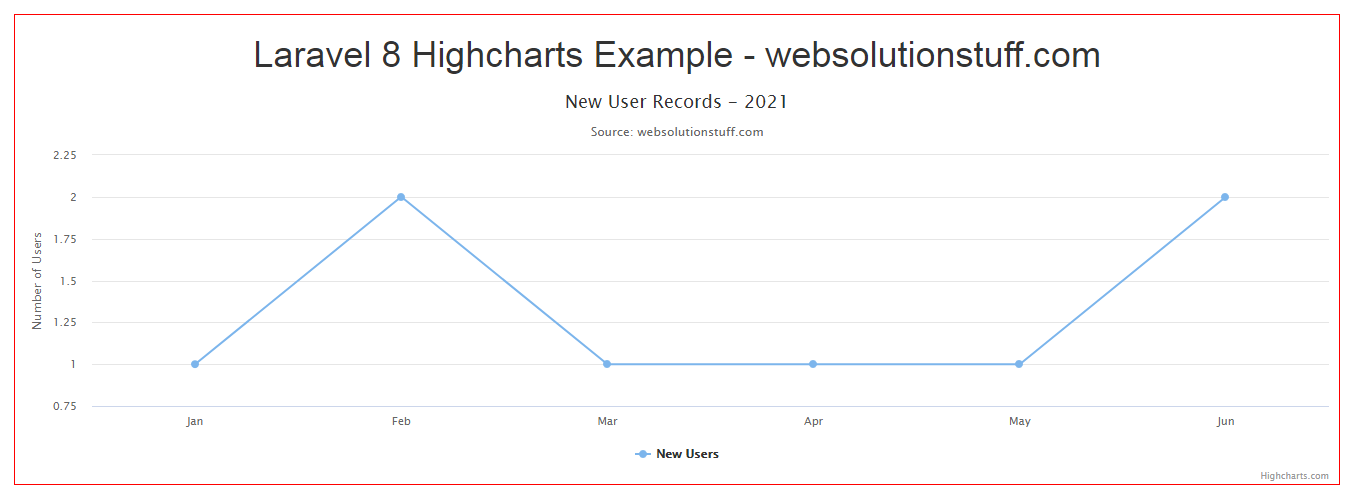
In this tutorial we will see laravel 8 highcharts example tutorial. you will learn how to implement a highcharts in laravel 8 using highchart js.using highcharts you can create interactive charts easily for your web projects. so, now we will see basic line chart using highcharts in laravel 8.
Highcharts is a javascript library, this library through we can use many charts like line charts, bar charts, pie charts, stock charts etc. Highcharts is a open source chart library.
For more information about highcharts : HighCharts Official Site.
A chart is a graphical representation for data visualization, in which "the data is represented by symbols, such as bars in a bar chart, lines in a line chart, or slices in a pie chart". so it's helpful in easy to understand.
So, let's start to implement Laravel 8 Highcharts Example Tutorial.
In this step add routes in web.php file
use App\Http\Controllers\UserController;

Route::get('highchart', [UserController::class, 'highChart']);
Now in this step create UserController in App\Http\Controllers path.
<?php

namespace App\Http\Controllers;

use Illuminate\Http\Request;
use App\User;

class UserController extends Controller
{
    public function highChart()
    {
        $users = User::select(\DB::raw("COUNT(*) as count"))
                    ->whereYear('created_at', date('Y'))
                    ->groupBy(\DB::raw("Month(created_at)"))
                    ->pluck('count');
        return view('index', compact('users'));
    }
}
In step 3 create blade file for display Highcharts in frontside so create index file in below path. and copy and paste below code in your file.
resources/views/index.blade.php
<!DOCTYPE html>
<html>
<head>
    <title>Laravel 8 Highcharts Example - websolutionstuff.com</title>
    <link rel="stylesheet" href="https://maxcdn.bootstrapcdn.com/bootstrap/3.3.7/css/bootstrap.min.css">
</head>
<body style="border:1px solid red; margin:20px;">
<h1 class="text-center">Laravel 8 Highcharts Example - websolutionstuff.com</h1>
<div id="container"></div>
</body>

<script src="https://code.highcharts.com/highcharts.js"></script>
<script type="text/javascript">
    var users =  <?php echo json_encode($users) ?>;

    Highcharts.chart('container', {
        title: {
            text: 'New User Records - 2021'
        },
        subtitle: {
            text: 'Source: websolutionstuff.com'
        },
         xAxis: {
            categories: ['Jan', 'Feb', 'Mar', 'Apr', 'May', 'Jun', 'Jul', 'Aug', 'Sep', 'Oct', 'Nov', 'Dec']
        },
        yAxis: {
            title: {
                text: 'Number of Users'
            }
        },
        legend: {
            layout: 'horizontal',
            align: 'center',
            verticalAlign: 'bottom'
        },
        plotOptions: {
            series: {
                allowPointSelect: true
            }
        },
        series: [{
            name: 'New Users',
            data: users
        }],
        responsive: {
            rules: [{
                condition: {
                    maxWidth: 500
                },
                chartOptions: {
                    legend: {
                        layout: 'horizontal',
                        align: 'center',
                        verticalAlign: 'bottom'
                    }
                }
            }]
        }
});
</script>
</html>
after that you will get output like below scheenshot.

Recommended Post
Featured Post

How To Validate Email Using jQ...
In this article, we will see how to validate email using jquery. we will use regular expression(regex) for email va...
Nov-09-2022

How To Use Google Recaptcha V2...
In this article, we will see how to use google ReCaptcha v2 in laravel 9. Google ReCaptcha is used for advance...
Jun-14-2022

Laravel 8 Eloquent orWhereHas...
In this example we will see laravel 8 eloquent orWhereHas() condition. In previous example we will learn about ...
Oct-15-2021

Mail: Laravel 11 Send Email us...
In this guide, we'll see how to send email using a queue in laravel 11. Here we'll see the concept of queue...
Apr-12-2024